COURSES
WEEKLY GRADES AND STUDENT COMMENTS
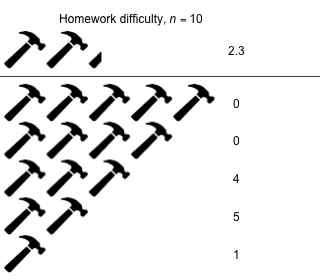
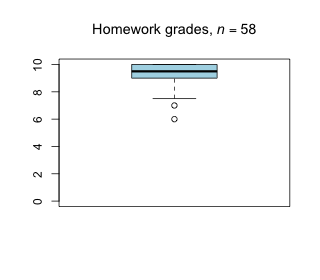
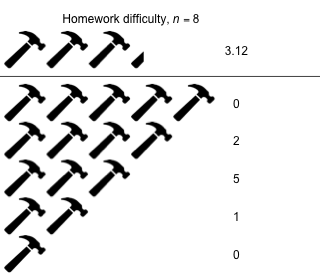
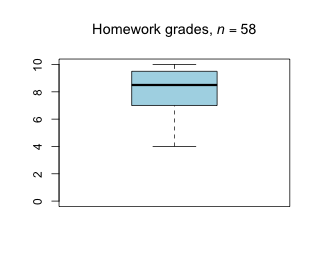
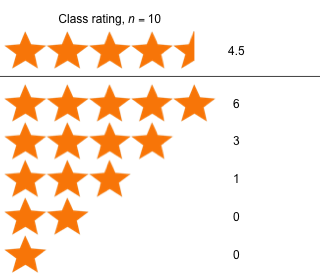
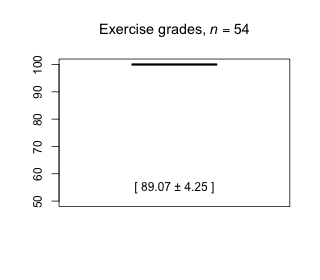
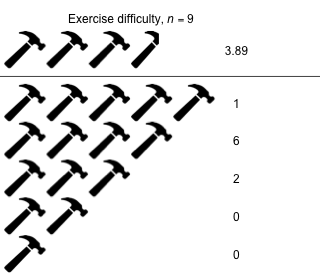
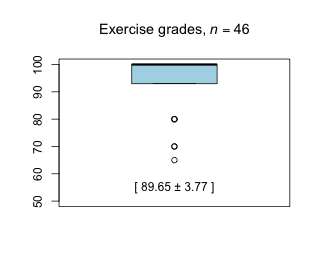
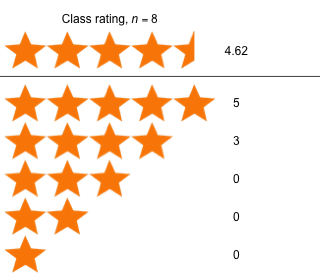
Week 13 - April 29, 2022

|
|
|
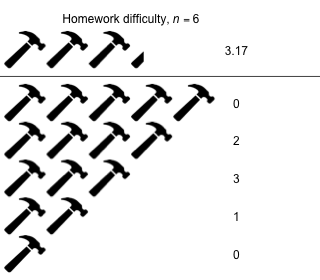
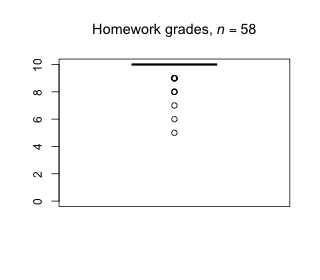
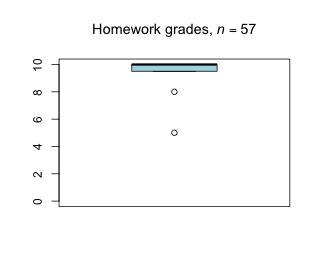
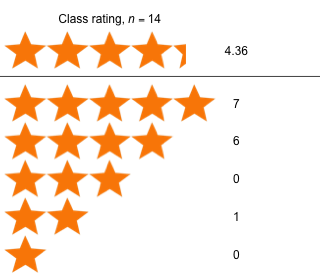
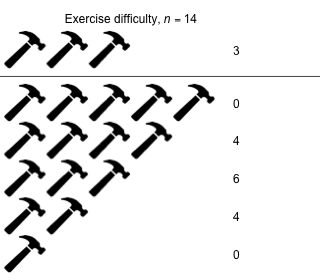
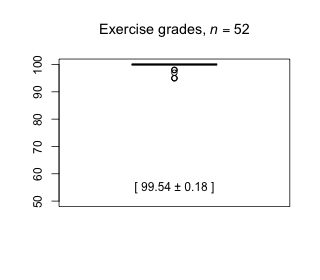
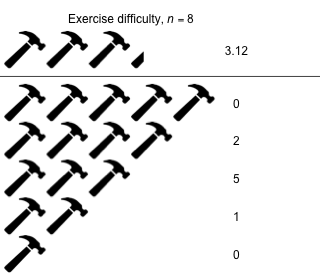
Week 12 - April 22, 2022

|
|
|
| Comments from students |
|
★
★
★
★
★
The class was nice and informative as always. |
|
★
★
★
★
★
Class was good enough and thanks for considering the request about the level of the homework. |
|
★
★
★
★
★
Good lecture. Homework makes us think a lot about why we're doing what has been taught in the lecture. Great help from Vitalii for homework. |
Week 11 - April 15, 2022

|

|
|
| Comments from students |
|
★
★
★
★
★
The class was very organized and helpful. I have a suggestion for which I might be wrong but I think it will be helpful to all the students: As the end semester is coming and we also have to spend more time on the project milestone 3 if the homework series will become a little bit easier than we can give more time to work on the project milestone. Hope you will consider this. |
|
★
★
★
★
★
The class was right paced and all the materials were well explained. |
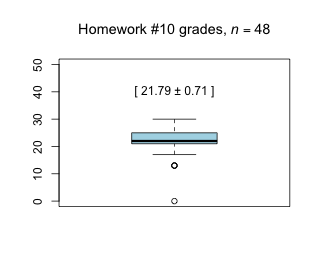
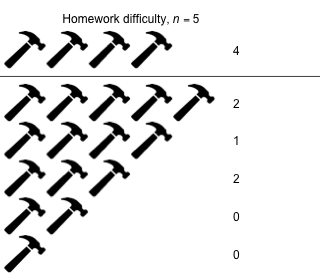
Week 10 - April 8, 2022

|
|
|
| Comments from students |
|
★
★
★
★
★
Professor's lecture was so good and clear. |
|
★
★
★
★
★
It was very disappointing after listening to the feedback from other students. I emailed the professor and TAs during the weekend, and I got all of my doubts resolved. There is no question that can be made about the response, delivery of the class, and the behavior of the TAs if one is attending the lecture carefully and regularly. It is one of the best classes I have ever taken, so no per me the professor can neglect those negative reviews, and I hope he will not think anything wrong with the students who are attending lectures sincerely and doing their job on time. Kudos to the professor and both TAs, they are doing their jobs at the best level. |
Week 9 - April 1, 2022

|
|
|
|
| Comments from students |
|
★
★
★
★
★
Please provide some more detail description in homework. |
|
★
★
★
★
★
The class was interesting. But I think today is the deadline for the project milestone. So, that might affect the overall interaction with the class. |
|
★
★
★
★
★
A few more hints to assignments would be good. |
|
★
★
★
★
★
Please be more descriptive in assignments and projects. What's taught in class is not enough to do the assignments. We have to wait till Monday to get clarification on many unclear instructions during the TA session. Vitalii helps us with our doubts but often times what he explains is not what is expected by Shaila. We confirmed with Vitalii that IQR is a good outlier removal method for HW 6 but that wasn't accepted by Shaila. |
|
★
★
★
★
★
The session was very insightful. The knowledge which I got from the theory and practical session related to the general linear model helped me in working on the assignment. |
|
★
★
★
★
★
In 6th assignment we followed the inputs per Dr. Pavlidis and Vitali. In the case of removing outliers we removed it after arrivign at a strategy after plotting the data. We removed the data after binding which abs difference is greater 16 as they are outliers. But, we were told this is not a good strategy but were never told which strategy to remove outliers is best suitable for the problem. I hope only way to make it clear would be to announce which strategy would be best suitable for current problem. Please correct me if I went wrong. Thanks. |
Week 8 - March 25, 2022

|
|
|
| Comments from students |
|
★
★
★
★
★
It is really notable and good to get a response over the weekend via mail from the professor. |
|
★
★
★
★
★
Thanks for adding more descriptions to assignments. |
|
★
★
★
★
★
The materials covered are pretty intense. However, professor went through the topics at a much reasonable speed. Maybe the methods like BE, FS, etc could be explained in a bit more detail in a more interpretable manner. Other topics were greatly explained. |
Week 7 - March 18, 2022

|

|
|
| Comments from students |
|
★
★
★
★
★
Excellent! |
Week 6 - March 03, 2022

|

|
|
| Comments from students |
|
★
★
★
★
★
Need more directions on the assignments. HW 4 was very difficult |
|
★
★
★
★
★
Unavailability of TA(Ms. Shaila) for doubts regarding Assignments before the deadline causing submissions with uncleared doubts. |
Week 5 - February 25, 2022

|

|
|
|
| Comments from students |
|
★
★
★
★
★
Need more time for homeworks |
|
★
★
★
★
★
The overall lecture is good. TA hours of Vitali is excellent. even he is answering on Sunday also. While this homework series is handling Shaila so Vitali is not going to certain answers as compared to the first homework series. so we asked Shaila for doubts but because of weekends, she might be busy so she didn't give answers to doubts. So it would be very helpful if homework is given by taking into consideration Vitali so students can ask doubts and submit the assignment by the deadline. Assignment complexity is difficult but because of not getting answers from the appropriate TA it becomes very difficult. |
|
★
★
★
★
★
Very informative reagrding lecture content and clear on expectation of upcoming HW/Projects |
|
★
★
★
★
★
need more time for assignments if possible. |
|
★
★
★
★
★
The class is indeed helpful as always. However, I missed some visual plots today. |
|
★
★
★
★
★
I understood the entire class and I have revised the slides also after the class. But what is to be expected from the homework part is quite confusing for me. I am literally struggling a lot with the interpretation of the tests' results. |
Week 4 - February 18, 2022

|
|
|
| Comments from students |
|
★
★
★
★
★
Topics are very interesting. |
|
★
★
★
★
★
Expecting a clear picture in the assignments. |
|
★
★
★
★
★
Had a better understanding of hypothesis testing. how and what based the data should be tested ( one sided, two sided (alpha)) to determine whether to reject or accept the null and their interpretation. |
Week 3 - February 11, 2022
|

|
|
| Comments from students |
|
★
★
★
★
★
I think Professor is at the right pace but the R programming part is going a little too fast. The TA is doing a great job though, just slightly slow should be perfect. If there is something in the R like Jupyter Notebook, where the code explanations can be put in English, that might be easier too. |
|
★
★
★
★
★
Class is very long. |
|
★
★
★
★
★
Knowledgeable and interesting. |
|
★
★
★
★
★
it is very difficult to get into home work |
|
★
★
★
★
★
It was an interesting class. Good to know that you have extended the deadline and given us some more time. Quite excellent and ready to help TA. Great work by Vitalii!! |
Week 2 - January 28, 2022

|
|
|
| Comments from students |
|
★
★
★
★
★
It is a lot of information in 3 hours. I think a frequent 5 minute break should be given accordingly so we can process all the information and maybe try a thing or two on our own to completely grasp the concept. The homework is really meticulous and a great practice. |
|
★
★
★
★
★
Please extend the deadlines for submission of the assignments |
|
★
★
★
★
★
The topics are pretty interesting. I really like the idea of diving into complex topics slowly. |
|
★
★
★
★
★
I think it would be great if the assignments are also allowed to do in teams with 2 members in each team . |
|
★
★
★
★
★
Hello, I am content with the way the class is conducted. I like the theory part followed by the practical learning. The assignment was also good, I learned lot new things related to R language and how to do some analysis in it. Thanks, Nilesh |
|
★
★
★
★
★
The class was good and Lab was very good. This is a new subject for us, the professor should give students some time for assignments and learn R and then submit assignments. else everything is good. |
|
★
★
★
★
★
The HW is not difficult but a little bit confusing even with the explanations. Could you please make it clearer and easier to understand next time? |
|
★
★
★
★
★
Hello Prof and TA, I have no complaints in teaching aspects but it's just if we have doubts in assignment during weekends, we have to wait for Monday (the day of deadline) for TA hours. Is there anything we can do about it? Thank you. |
|
★
★
★
★
★
The content and the code explanation helped a lot for understanding and completing the assignment. |
|
★
★
★
★
★
The session was quite excellent and useful while doing homework. I have one suggestion, it might be wrong but this is what I felt. Homework is assigned in the class, at that moment we are not prepared to make questions. Once we actually implement the script, that moment we encountered more queries. TA hour is on Monday, so we can clear maximum doubts in that session. The best thing is Vitalii was replying on Teams on Sunday also, but it might be possible he is not available. At that moment we might not get enough time to solve our doubts and fix the error in the script. So, I think the management can adjust this thing either by changing TA hour or by giving some more time after TA hour. |
Week 1 - January 21, 2022
|
| Comments from students |
|
★
★
★
★
★
well organized class structure |
|
★
★
★
★
★
course structure is nice |
|
★
★
★
★
★
The intro session was good and I liked the immediate responses given by the TAs to the questions raised. But the break in between could be a bit longer in my opinion. |
|
★
★
★
★
★
The way sessions are conducted that is first starting with some theory and then doing some practical is a great way of understanding the concepts. |
|
★
★
★
★
★
I think the class is good and informative but I feel it is somewhat fast when it comes to R programming according to me. |
|
★
★
★
★
★
The first session was very informative and haste. I would request you to explain the topics slowly so i can cope up. |
|
★
★
★
★
★
Class was good and easy to understand, bit fast paced but was well organized. |
|
★
★
★
★
★
The lecture was very informative. |
|
★
★
★
★
★
It was a recall of the previous topics and the introduction to R was great! Looking forward to learning more about it. |
|
★
★
★
★
★
From the first class, had a good understanding of the fundamentals, syllabus and requirements of this course. |
|
★
★
★
★
★
The class is very informative and well-organised. The pace of the class seemed a little fast for me especially the session on R maybe because, I am completely new to R! |
|
★
★
★
★
★
I felt that the assignment deadlines could be a little extended, and since the class is on Friday, and 3 days for submission will make us work on the weekends, which is okay sometimes but we might me occupied by other things or so. |
|
★
★
★
★
★
The first class was good, I felt the first class was fast-paced, so maybe in the future session, it would be great if the pace was slowed down a little. |
WEEKLY GRADES AND STUDENT COMMENTS
Week 12 - April 23, 2021

|
|

|
|
★
★
★
★
★
It's actually good. |
|
★
★
★
★
★
Overall the class was good, the topics felt very clear. For the practice session, I also was having trouble understanding the block design in terms of commands. I didn't quite understand how Rstudio treats the design as a block without having to specify which variable is your blocking variable. |
Week 11 - April 16, 2021

|
|
|
|
★
★
★
★
★
Today's lecture was very helpful as always. The high level information combined with the explanation from the professor was helpful to understand the information, and the example using the MPG data helped me visualize the concept. Additionally, the deeper discussion regarding the project was extremely beneficial for me. |
|
★
★
★
★
★
well understood. |
|
★
★
★
★
★
Great explanation. |
|
★
★
★
★
★
The class was very interesting and practical experience is very good. |
|
★
★
★
★
★
I had trouble following along with todays lecture for some reason. I think maybe it was just the speed you went through the slides, it felt like a lot to take in. The Rstudio session was also rushed, but that was understandable since class ran long with the questions. I'm still a little lost on how to do the last portion of the project, but I'm hopeful that we will go into more detail about it in the next lecture perhaps or maybe it will just become more clear as we progress with lecture and the Rstudio practice. |
Week 10 - April 9, 2021
|

|
|
|
★
★
★
★
★
Clarifications of the doubts in the class are really helpful and the class is really interesting. |
|
★
★
★
★
★
Today's lecture was particularly helpful with the lengthy discussion of the figures for the next part of the project. Additionally, the theory for logistic regression was very helpful to understand the concept |
|
★
★
★
★
★
Things are coming together now. Looks like the 3rd part of the project will be both challenging and fun. |
|
★
★
★
★
★
Having difficulties to do homework even after reviewed the lecture video couples of times. |
|
★
★
★
★
★
The class felt a little rushed, but maybe that's just due to it being short. I appreciated the time you took to go over the third and final part of the project, I hope that we can go into more depth as the class progresses I feel like the second portion of the project wasn't covered enough. The example Rstudio session was well done. Going in I wasn't sure what we were doing and by the end I understood enough to do the in-class exercise with some difficulty. |
|
★
★
★
★
★
no comments |
|
★
★
★
★
★
The whole lecture was very interesting and also easy to understand. |
Week 9 - April 2, 2021

|
|

|
|
★
★
★
★
★
It was good. |
|
★
★
★
★
★
Overall it was a good lecture, but it was somewhat hard to follow. I couldn't make some of the connections you were making and that may have been helped with examples or maybe not going quite as quickly through the material. |
|
★
★
★
★
★
Understood dummy variables. Need to review the second half of lecture again. Class exercise reinforced some of the concepts. |
|
★
★
★
★
★
class was interesting and class followed by relative assignments made me to revise the previous class which helped to have a clear idea in those topics |
|
★
★
★
★
★
Lecture was good and helpful. |
|
★
★
★
★
★
Everthing's clear and easy to understand and implement. |
|
★
★
★
★
★
This lecture was helpful for me to understand the underlying theory of a couple different approaches for linear models, but I had trouble grasping the difference between linear regression and linear modeling in terms of theory. However, the distinction that the application for different factor levels was helpful. |
|
★
★
★
★
★
Vitali's demo was a little rushed and it was a tad hard to relate it to the exercise |
|
★
★
★
★
★
I really like the way the class is going including the practical implementation of the topics covered and the time you give at the end of the lecture for the exercise try out. It seems really interesting. |
|
★
★
★
★
★
It was something new to me, and I think both professor and Vitalii did a great job on the topic! |
|
★
★
★
★
★
I'm very comfortable with the the lecture and also the practical session provided by the TA. It is very clear and I could clear all my doubts during the session too. |
Week 8 - March 26, 2021
|
|
|
|
★
★
★
★
★
I got a little lost at the end with the C(p) portion, but overall it was a great class. I appreciated the time spent talking about the second part of the project and it clarified a few things I was stuck on. |
|
★
★
★
★
★
Everything is clear and easy to get. |
|
★
★
★
★
★
Started understanding multivariate regression and ability to deduce response variable based on their combination. |
Week 7 - March 12, 2021

|
|

|
| Comments from students [show / hide] |
|
★
★
★
★
★
Thanks for the examples and great explanation by vitalli. |
|
★
★
★
★
★
The lecture information was helpful and provided enough detail to help me understand the theory behind linear regression without becoming too complicated. The portion of class dedicated to discussion of the second project milestone was also highly appreciated. |
|
★
★
★
★
★
The class is pretty interesting with parallel practical work. |
|
★
★
★
★
★
This was probably the best class to date. I appreciated you going over the project first and taking the time to explain what the plots were. The practice was particularly helpful for the exercise today and sometimes it feels like this is a learn to use Rstudio course more than a statistics course. For example, with the project, which felt very much like a test of how well I could use Rstudio, but today's exercise didn't feel that way. I also appreciated the clear expectations for the second part of the project, so thank you. |
|
★
★
★
★
★
At the end of the class, I'm really happy as I have information about the ANOVA test and how to implement it on some data. For me, it's a valuable class. I appreciate it. |
Week 6 - March 5, 2021

|
|
|
| Comments from students [show / hide] |
|
★
★
★
★
★
Thank you for the extension and the hints provided during the class. Is there a chance we can get the answers/explanation for homework 1? |
|
★
★
★
★
★
Classes are so far so good. |
|
★
★
★
★
★
I had some confusion based on the first project and what was expected from us. The class mostly cleared it up, but having the expectations explicitly outlined in the syllabus or on blackboard would've been helpful, maybe for future classes or for the second assignment if it's not too much trouble. One other thing, in a previous lecture you stated that the third plot was the intersection of the first and second (the lecture on Feb. 05), which made the plot clarification given today confusing since I don't believe that is actually the intersection (I could be mistaken). In any case, it would've been helpful to clarify with more time to fix the plot, again probably something for future classes. Overall the lecture today was good and I learned a lot, I really appreciated detail you both went into during the Rstudio portion of the class. Thank you! |
|
★
★
★
★
★
I think I understood this one the best. Good class! |
|
★
★
★
★
★
At the end of the class, I'm really happy as I have information about the ANOVA test and how to implement it on some data. For me, it's a valuable class. I appreciate it. |
Week 5 - February 26, 2021

|
|
|
| Comments from students [show / hide] |
|
★
★
★
★
★
Overall I think today was a great class. I was a little lost on the discussion about the project and that has me worried that I am somehow behind. But overall I think the length of the class has been better the last two meetings and really appreciate the time in class to do the mini-assignment. |
|
★
★
★
★
★
It'll be helpful if you could explain more about the gephy for the upcoming project. |
|
★
★
★
★
★
very helpful as ur giving the hoemwork realted to the previous class |
|
★
★
★
★
★
The class is very interesting with a parallel practical and hands-on approach. |
|
★
★
★
★
★
The pace of this lecture was good for me and the information provided for gephi and for R for the project tasks was very concise and helpful. |
Week 4 - February 12, 2021

|

|

|
| Comments from students [show / hide] |
|
★
★
★
★
★
Great lecture and tutorial. Would it be possible to see the answers for the exercises posted after the due date? I think it would help with the homework a lot. |
|
★
★
★
★
★
As I learn the theory of statistical methods and implement them on R studio , I'm getting more confident to use R programming. |
|
★
★
★
★
★
Today's lecture was very helpful to provide a high-level view of common test statistics and how they are computed and applied. Additionally, the information about the project was helpful for me as well as the R tutorial. |
|
★
★
★
★
★
This class was much simpler to follow than previous portions |
|
★
★
★
★
★
Good lecture. |
|
★
★
★
★
★
This class was particularly good. I liked that there was time at the end to work on the weekly assignment so we could ask questions if needed. |
Week 3 - February 5, 2021

|
|

|
| Comments from students [show / hide] |
|
★
★
★
★
★
Today's class was very usefull. Dr. Pavlidis's lecture moves at a reasonable pace (for me) and tends to focus on important, high level information without going into too much detail about the underlying statistics/mathematics. Additionally, the R tutorials continue to be helpful for me and I find they are paced well |
|
★
★
★
★
★
It's been a good to learn more about the subject, as i get to learn new things and get to know more about the subject. Explaining more in deep would be a better like explaining with more examples would be easy to understand, other than that everything 's fine. thank you. |
|
★
★
★
★
★
Like the material being covered, the real world data analysis project, and practical help being provided by Vitali! I am coming back to school after a while and am a bit rusty with Math. Will covering the stats course at Khan Academy give me enough background to get a solid foundation for this course? |
|
★
★
★
★
★
Informative! |
|
★
★
★
★
★
The class would be interesting if the professor tells us more examples about the theoretical concepts like drawing things on the screen to give us more clarity. |
|
★
★
★
★
★
The class was nice and the professor explained everything very nicely. The TA also demonstrate materials nicely/ |
|
★
★
★
★
★
I would enjoy it if more in person classes are organised and a parallel on hands experience would do great in the meetings. |
|
★
★
★
★
★
Please reduce the Pace of your explanation and try to conduct atleast a class in-person in a month to revise all the topics coververed so that we can have more interaction. |
|
★
★
★
★
★
Much better today, but the practical portion was still far too quick. I couldn't keep up and it was hard to follow, please try to slow down with the examples, I like to try to understand how the code works and its hard to do that when you skip ahead. |
Week 2 - January 29, 2021
|

|

|
| Comments from students [show / hide] |
|
★
★
★
★
★
Kindly, slow down the pace and use as many as examples to demonstrate in practical part of the class. |
|
★
★
★
★
★
The lab portion of the class was extremely rushed so it was hard to get anything useful from it. |
|
★
★
★
★
★
Please provide examples. |
|
★
★
★
★
★
The duration of the class is long, it will become less interesting as time passes. It would be better if the duration of the class is one and a half-hour each on two weekdays. |
|
★
★
★
★
★
I like the way you teach in class. But the pace of the practical class is fast. |
|
★
★
★
★
★
Thank you for your lecture. |
|
★
★
★
★
★
The R programming part was very fast. It would be better to cover the basics of each part slowly than to go fast through the whole code. |
Week 1 - January 22, 2021

|
| Comments from students [show / hide] |
|
★
★
★
★
★
Class is helpful for both theory and code sections. Thank you! |
|
★
★
★
★
★
The exercises you worked through at times went too quickly for me, but outside of that the class was very useful. The class itself feels a bit long to be honest, it would've been nice to have two days at one and a half hours or two hours, three just seems like a lot for one time in my opinion, but that could just be me. I really did learn a lot and it was very interesting and I'm excited to learn more. |
|
★
★
★
★
★
Bit of audio problem, but otherwise great lecture. Liked the practical aspect and hands on coding. |
|
★
★
★
★
★
For the break, I would suggest objective time frames so we know how much time we have. Something like "we will take a break until [insert exact time]" would be helpful. Other than that, the lecture was very helpful |
|
★
★
★
★
★
The lecture was informative and a good review on some material I learned in previous courses. |
|
★
★
★
★
★
I've had no previous experience in R so this was a very good and useful introduction for me. |
|
★
★
★
★
★
First lecture was very clear and concise with its goals and content. The R introduction was also extremely helpful and structured very well. |
Interesting assignment.
The session was really helpful in terms of explaining the rank variables. The grading consideration by the professor (i.e., backlog issue) was thoughtful and nice.
The class was very nice and organized.